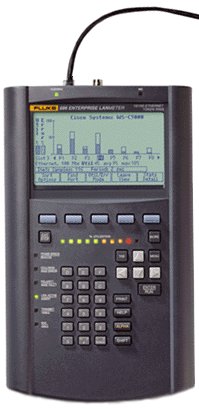

Fluke LANMeter
TSCM services on computer networks are highly specialized activities which requires a highly specialized background and extensive training. This specialized service requires the usage of several instruments:
These instruments are used in addition to Oscilloscopes, Spectrum Analysers, Multi-meters, Search Receivers, NLJD, X-ray, and other regular TSCM equipment.
The Fluke LANMeter® provides an excellent instrument for TSCM teams. The "basic instrument" offers all the functions of a cable scanner, including a high quality dry-line TDR. The traffic analysis features are invaluable for identifying and tracing network abuse, hacker intrusions, and detecting covert eavesdropping devices on the network. The LANMeter® is also invaluable for performing periodic network audits and reviews.
The Fluke DSP-2000/DSP-4000 Cable Analyzer and Fluke 105B Scope Meter are also excellent instrumentation for TSCM inspections, and complement the LANMeter series well.
During a TSCM inspection an Oscilloscope will be typically be the first instrument attached to the network being evaluated, the purpose is to observe the waveforms and signals present. In the event that a spread spectrum eavesdropping device has been installed on the network the oscilloscope will provide rapid detection. The oscilloscope will also provide a quick indication of the voltages present, the amount of RF noise, and limited information about cross-talk. One thing to watch for is the presence of any signal that does not match the template of "what should be on the network". For example why is there a steady 128 kHz, low level PPCM signal riding on the Ethernet wave form.
The second instrument used will typically be the Portable Spectrum Analyser. This instrument is used to take a quick look at the RF spectrum being used by the network. Normally a network will contain a small amount of noise along with the primary signal with a number of harmonics. Watch for the presence of any signal that does not match that typical for the type of network being tested. The Spectrum Analyser will also be used later when performing frequency domain and space domain inspections of the wiring closets.
Once all conductors combinations of the network have been carefully checked for foreign signals (by using an Oscilloscope and Spectrum Analyser) a Network Traffic Analyzer is used to monitor all activity which occurs on each specific segment (or cable drop). The purpose is to identify any anomaly in network traffic which could indicate the usage of eavesdropping software or a security weakness being exploited. A typical example of this would the usage of audio streaming or keystroke logging software which have been a popular method for eavesdropping. (Why is the CEO's Windows NT box streaming audio and video to a computer located outside the company?)
A Network Traffic Analyzer will typically evaluate only the headers of the packets, and should allow the user to perform several basic network functions such as Ping, Trace Route, DNS lookups, and provide lists of found or active network addresses. At this point the TSCM specialist will have obtained a list of all network entities which should then be verified by a physical inventory.
In the event that suspicious activities are detected a Packet Sniffer can then be used to capture and analyze the suspect activities. A Network Traffic Analyzer is typically used to observe headers, and the Packet Sniffer is used only after suspect activity is noted. A Packet Sniffer should be utilized as little as possible as it raises serious security issues, privacy concerns, and will typically provide "too much information" regarding network traffic.
Prior to this point all tests have been non-invasive, fairly undetectable, and should not have alerted the eavesdropper that a TSCM inspection is in progress.
The TSCM specialist will now cause a segmented network outage (typically caused by turning off a router or hub) and will disconnect all associated wiring. This isolates a group of computers and wiring from the rest of the network, and will provide "appropriate cover" for the remainder of the TSCM inspection.
At this point the physical wiring will be checked for any eavesdropping device, or anomaly. A cable scanner will be used to provide a basic wire map, and a TDR will be used to check for cable splices or taps. Once the cable has been "mapped-out" and the length has been determined by using a TDR a near-end/far-end cross talk analysis will be performed to locate inductive or capacitor isolated devices. Products such as the Fluke DSP-2000 or DSP-4000 are ideal for testing the physical wiring, and will also provide highly accurate cross talk analysis.
It may also be beneficial to also perform a Sweep Analysis of the cabling (with a Spectrum Analyzer and Sweep Generator) to identify any frequency response related anomalies.
Be sure to check all conductor combinations, and all references to ground, and structural components for signal paths. When checking UTP wiring be sure to check all four cable pairs, and check the voice cabling at the same time (easy to do when four Smart Remotes are being used), but ensure that all cabling is "dry" (has no signal on it) before performing any tests.
Before bringing the network back online, always connect/re-connect the Traffic Analyzer to watch for any suspicious activity immediately after the network is brought back online. Eavesdropping software will often attempt to re-connect to the host immediately after the network comes back on-line.
Also, perform a visual inspection on all cable and wiring which can be accessed (yes, this will involve climbing a ladder and moving ceiling tiles), and open up all wall-boxes and inspect them with a borescope.
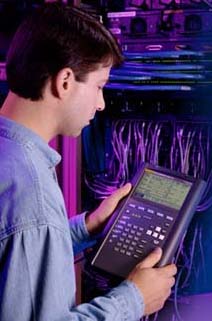 The Enterprise LANMeter® - powerful network analysis,
right in your hands.
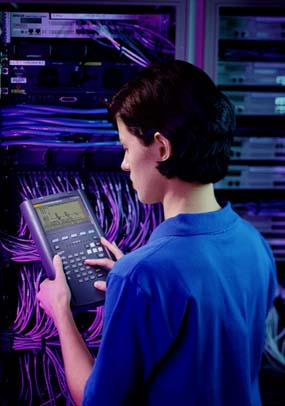
The Enterprise LANMeter® - powerful network analysis,
right in your hands.Plummeting per-port costs for Fast Ethernet hubs and user demands for higher bandwidth to the desktop are forcing many networks to adopt 10/100 Ethernet as the technology of choice for growth and for replacement of aging hardware. To support this trend, Fluke added direct connectivity for 10/100 Ethernet to the already popular Enterprise LANMeter series test tools.
The 683 (10/100 Ethernet) and 686 (10/100 Ethernet, and Token Ring) Enterprise LANMeters take advantage of the support for Fast Ethernet offered by implementing a complete auto-negotiate sensing capability. Users may connect to 10 or 100 Mbps Ethernet drops indiscriminately, and the instrument will automatically detect which speed is present and link accordingly. Or, if advanced testing is appropriate, the user may configure 10 or 100 Mbps explicitly in order to force a connection at the desired speed.
Are Fast Ethernet switched hubs frustrating to troubleshoot? Connect to a 100 Mbps port anywhere on the network and you will begin to see some of the Fast Ethernet LANMeter features.
The Enterprise LANMeter functioning as an HTTP server supports a
centralized network management philosophy by providing you access to
its troubleshooting and analysis information from a remote location.
In addition to the features found in the 682 or 685 Enterprise LANMeter,
the 683 and 686 offer the following:
For existing 672, 675, 682 and 685 users, enhancement kits are available to allow you to convert your existing LANMeter product to a 683 or 686 Fast Ethernet Enterprise LANMeter.
Ethernet
Network Statistics
Monitor the general health of a network by calculating statistics for key network parameters. The results show Utilization, Collisions, Errors, and Broadcasts as average, maximum, and total values, in numeric and bar graph formats. .
Error StatisticsNetwork eavesdropping devices will usually cause an increase in network errors (usually CRC and ghosting errors). Concealed eavesdropping which also transmit RF signals will also cause errors to be introduced into the network as electrical noise.
Monitor he types and sources of errors. Display chart which shows error distributions by error type. For Error Types that are preceded by the icon, highlight the specific Error Type and press the "Zoom In" softkey to obtain a list of stations causing those errors.
When the "bandwidth" of senior executives network connection suddenly decreased (overnight) the technical support people suspected a poor network connection. When the LANMeter® detected astronomical error rates the security department was notified and a TSCM sweep was scheduled. During the TSCM inspection an RF eavesdropping device was found on the executives phone line, and a software eavesdropping routine was found on his computer. The device and program had been installed by one of the junior employees who was trying to spy on his boss.
Continuous bandwidth coming from or to a computer (that is not a server) may be a key indicator that someone is eavesdropping via the audio or video port on a computer (very popular in Aerospace and Biotechnology companies).
Token Ring
Network Statistics
Monitors the general health of a network by calculating statistics for key network parameters. The results show Utilization and Soft Errors in numeric and bar graph formats, and other key frames as average, maximum, and total numerical values.
Error Statistics
Monitors the types and sources of network errors. Displays results in numerical and pie chart formats. Highlight a category and press the "Zoom In" softkey for fault domain address information.
Token RotationCalculates the time for the token to travel completely around the ring. This test shows the last, average, and maximum values for token rotation time and the number of active stations. The LANMeter analyzer also reports when token rotation is outside of the normal range.
Ring StationsMonitors the Network and compiles an ordered list of stations inserted into the ring. The list is in the correct physical order around the ring, starting with the active monitor.
Stations may be displayed in the following address formats, depending on which are known; symbolic name, manufacturer prefix, or hexadecimal MAC address.
Use the active monitor history screen to view a time-stamped log of which stations have been the active monitor. This helps you isolate hard-to-find problems related to which station is the active monitor.
Beaconing Rings
Push one button and, in seconds, the LANMeter analyzer will insert into a beaconing ring and automatically identify the fault domain. No more wading through screens of decodes to extract the buried fault domain information. A beacon alert pop-up window is displayed when the LANMeter analyzer detects beacon frames on the network.
Ethernet and Token Ring
Protocol Mix
Displays a percentage-ranked listing of the top protocols measured by frame count on the local segment. The LANMeter analyzer automatically identifies encapsulation types for IPX. Highlight a protocol and press the "Zoom In" softkey for a list of the top stations transmitting that protocol. The list of all protocols and stations recorded for each protocol may be printed or viewed.
Top SendersMonitors the busiest transmitting nodes on the local network. The LANMeter analyzer can be configured to filter on a single address and show the top senders to a particular station.
Top ReceiversMonitors the busiest receiving nodes on the network. Information is displayed in the same format as Top Senders.
Top BroadcastersMonitors the type and source of broadcasts and can be used to identify mis-configured stations. The LANMeter analyzer distinguishes between broadcast, multi-cast, and non-broadcast frames for Ethernet. For Token Ring, the LANMeter analyzer distinguishes between all routes, single routes, no route control, and non-broadcast frames.
Traffic Generation
Traffic generation is used to stress test network components. Adding traffic reveals media and other physical layer problems on networks. The traffic generator may be run concurrently on Ethernet networks with Network Statistics, Error Statistics, and Collision Analysis, and on Token Ring networks with Network Statistics, Error Statistics, and Ring Stations.
Use traffic generation to characterize network behavior in high traffic circumstances. User selectable parameters include frames-per-second of added traffic and frame size. To assist in testing bridges and routers the LANMeter analyzer automatically builds IP and IPX headers, all you need to supply is the source and destination address.
While the test is running, users may increase or decrease the current frame rate and size on-the-fly with the cursor keys. This is particularly useful when trying to locate sources of throughput problems and failure conditions.
For Token Ring networks select among three different worst-case data patterns. These patterns are known to test for correlated phase jitter sensitivity resulting from cabling, adapter card, and interoperability problems.
Traffic generation is critical when performing TSCM sweeps as may digital and spread spectrum eavesdropping devices only transmit when the buffers are full, and only emits RF energy during those times.
MAC Matrix
Monitor the busiest transmitting nodes on the local network and displays test results by Source/Destination address pairs. Test results include frame count transmitted by each address in the pair combination. When address filtering is on, displayed conversations are limited to those that are to or from the filtered address. With filtering off, the test tracks the first 512 conversing station pairs seen on the network, displaying the busiest eight.
A list of all conversations recorded as transmitting during the test may be printed or viewed.
TCP/IP Analysis
IP Auto ConfigurationAutomates IP configuration of the Enterprise LANMeter analyzer. Searches for a usable IP source address, the correct subnet mask, a default IP router and any available DNS server. The Auto Configure feature can be used in Assisted mode or make use of Dynamic Host Configuration Protocol (DHCP) or BOOTP servers.
Segment Discovery
Analyzes the attached IP network cataloging critical IP network attributes. Automatically identifies problems such as incorrect subnet masks, duplicate IP addresses and advertised services not available.
Segment Discovery also searches for IP Routers, Subnet information, DHCP and BOOTP servers, Name Servers, SNMP Agents and Local Hosts. Categories may be highlighted and further information obtained by pressing the "Zoom In" softkey.
The segment discovery is invaluable to TSCM teams when determining "who else is on the network". Very often an eavesdropping device will have it's own network identity, or will bridge the network to a secondary off-site location (such as a listening post). The TSCM specialist must be able to quickly identify all entities on the network (passive or active) and trace their source.
Internet Toolkit
This test may be run as a stand-alone test or accessed via Hypertext links from other Internet tests. The Internet Toolkit contains tests that will provide a more in-depth analysis of a particular node.
The SNMP-based features of the Enterprise LANMeter analyzer using MIB and RMON queries is unique in a handheld product and expands the troubleshooting capability of the LANMeter analyzer beyond the attached local segment.
Obtain information on intelligent devices using System Group Query.
Verify routing tables using the Route Table Query, or ARP caches using ARP table.
Use Interface Statistics queries to check interface status.
Obtain additional information by interrogating the device's Interface Statistics.
And discover problems using the Interface Error information.
Check DNS Server information by querying the server for either an IP address or for a name.
Use Ping Tests to validate connectivity to a host and utilize RMON Statistics Studies to obtain information on remote segments.
Trace Route
Performs a Trace Route function to aid diagnosing the cause of serious performance problems or connectivity problems. The IP address of each router and response time is reported together with its name if discovered.
The Trace Route function is one of the most powerful routines to utilize when a security anomaly has been detected (or suspected).
Scan Host
Verifies a hosts IP configuration by reporting the MAC address the subnet mask and the IP address of a usable default router. If a DNS server is configured, the host name is also reported. The test also monitors the IP traffic to and from the host, and also verifies connectivity by pinging the device.
ICMP Monitor
Identifies congested devices, and mis-configured routers and hosts by monitoring key ICMP packets. Monitors and displays the number of key IP events detected. Frame types monitored include; Destination Unreachable, Redirect, Source Quench, Time Exceeded, and Parameter Problem. The stations sending the most traffic in each category may be identified by "Zooming" on the desired category.
ICMP PingVerifies connectivity to a particular IP station. The target station address symbolic name may be chosen from the station list or entered in dotted decimal notation. The resulting IP address, MAC address, number of responses and response time is displayed.
IP Matrix
Monitors the busiest transmitting IP hosts on the local segment and displays test results by Source/Destination address pairs. Test results include frame count transmitted by each address in the pair combination. When address filtering is on, displayed conversations are limited to those that are to or from the filtered address. With filtering off, the test tracks the first 512 conversing station pairs seen on the network, displaying the busiest eight.
A list of all conversations recorded as transmitting during the test may be printed or viewed.
Top IP SendersMonitors the busiest transmitting IP nodes on the local segment. The LANMeter analyzer can be configured to filter on a single address and show the top senders to a particular station. The data is displayed in the form of a pie chart, together with a list of the top frame senders. Station addresses may be displayed as either symbolic name or IP addresses by a single keystroke.
Top IP ReceiversMonitors the busiest receiving nodes on the local segment. Information is displayed in the same format as Top IP Senders.
NetBIOS AnalysisNetBIOS is growing as more networks utilize Windows NT, Windows 95 and IBM LAN Server. The Enterprise LANMeter analyzer provides unique troubleshooting capabilities that allows you to discover problems such as mis-configured NetBIOS end-nodes, duplicate NetBIOS names and the causes of high NetBIOS traffic.
IP Auto ConfigurationFor NetBIOS over TCP/IP, automates IP configuration of the Enterprise LANMeter analyzer.
Segment Discovery
Analyses the attached NetBIOS network cataloging critical network attributes. Automatically identifies problems such as duplicate names, registration errors and default router not responding to ARP.
Categories may be highlighted and further information softkey.
Use "View Detail" to access all information about the host.
NetBIOS PingTest network layer connectivity by pinging a node by name. A NetBEUI ping will be local to the attached segment and is not routable. A NetBIOS ping over IP or IPX/SPX can cross IP and IPX/SPX routers respectively.
Top NetBIOS SendersMonitors the busiest transmitting NetBIOS nodes on the local segment.
Top NetBIOS ReceiversMonitors the busiest receiving NetBIOS nodes on the local segment.
Novell NetWare AnalysisThis selection of tests diagnoses problems on Novell networks by verifying client and server connectivity across IPX routers, monitoring NetWare statistics and routing, and keeps track of top traffic contributors.
Server List
Displays a list of servers available from a specific network location. It is similar to the display servers function provided on Novell Servers. The resulting display shows the symbolic name, IPX network address, and response time. Use NetWare encapsulation choices to help resolve configuration problems.
NetWare PingVerifies connectivity of a Novell Client or Server. The target station address symbolic name may be chosen from the station list or entered in hexadecimal. The resulting IPX address, MAC address, number of responses and response time is displayed.
File StatisticsProvides statistics that may be used to evaluate the overall health of the NetWare traffic on the local segment by monitoring file requests and other key NetWare frames and statistics. The stations sending the most traffic in each category may be identified by "Zooming" on the desired category.
Packet Statistics
Provides statistics that may be used to evaluate the overall health of the NetWare traffic on the local segment by monitoring key NetWare frames and statistics. Monitors delay packets, routed traffic, and burst mode traffic. The stations sending the most traffic in each category may be identified by "Zooming" on the desired category.
Routing Analysis
Only LANMeter helps you load-balance your IPX routed traffic. The display distinguishes between local-to-local, local-to-remote, and remote-to-remote traffic. Calculations are based on frame count. The stations sending the most traffic in each category may be identified by "Zooming" on the desired category.
Top IPX Senders
Monitors the busiest transmitting IPX nodes on the local segment. The LANMeter analyzer can be configured to monitor the top senders to a particular station.
Top IPX ReceiversMonitors the busiest receiving nodes on the local segment.
Banyan VINES AnalysisThis selection of tests provides information to help troubleshoot, load balance, and tune Banyan VINES networks.
Address ServersDisplays a list of all VINES routing servers and routers on the segment that assign the dynamic Banyan addresses to VINES clients entering the network.
Server Discovery
Displays all of the VINES servers on your network.
Top VINES SendersMonitors the busiest transmitting VINES nodes on the local segment.
Top VINES ReceiversMonitors the busiest receiving VINES nodes on the local segment.
Web Browser Remote Viewing
Any java-enabled web browser now allows senior network support staff to assist network technicians or remote office staff in diagnosing and interpreting network problems with the Enterprise LANMeter. A quick telephone call to provide the instrument's current IP address permits anyone with a web browser to see the current instrument display. No more awkward dialogs where the experienced technician is trying to guess over the phone what test the user is running, or trying to imagine what critical bit of information the user didn't think was important enough to mention. By using the web browser reload or refresh feature, changes to the instrument display are available almost as quickly as for the person holding the instrument. The web browser may also be used to retrieve stored test results and view configurations remotely. Features available through virtually any web browser include:
- View the current Enterprise LANMeter display
- Retrieve test results
- Retrieve screen captures
- Retrieve station lists
- Retrieve data logs
E-mail Support for Test ResultsIncreased use of TCP/IP driven by Internet access has provided an opportunity for Fluke to facilitate the easy retrieval of test results from the Enterprise LANMeter. After configuring the instrument with a valid TCP/IP address and the identity of your mail server, all test results stored in the instrument may be immediately e-mailed to your mail account via a just-tested network connection.
Stored results that may be e-mailed in this manner include:
- Test results
- Screen captures
- Station lists
- Datalogs
Improved Virtual Network (VLAN) Support
Access to private MIB information and enhanced detection of VLAN traffic, such as Cisco's Inter-Switch Link (ISL) protocol, allows the Enterprise LANMeter to monitor individual backbone segments for bandwidth consumption and top talkers.
Information about detected VLAN traffic, and VLAN configurations on a per-port basis for the most popular switches are available at a keystroke, and without any required configuration of the Enterprise LANMeter.
SwitchWizard™ lets you see exactly what's happening in your switched network.WideAreaWizardTMFlukes's new SwitchWizard™ lets you see into Ethernet and Token Ring switches for a more complete view of your network.
Enterprise LANMeter® WideAreaWizardTM Option now allows you to discover and diagnose problems on Wide Area Links.
Improved Documentation CapabilitiesDocumenting which user(s) are attached to which switch port has been a labor intensive challenge until now. The SwitchWizard option now provides the ability to store bridge forwarding table information for export to a PC or printer from all standard switch products via a single keystroke. This ability will permit network support staff to significantly enhance the quality of network documentation with little effort.
The Data Log function has also been enhanced to permit recording of an entire week's worth of statistics. The logging function permits configurations of five or seven consecutive 24-hour log files with no user intervention. These log files may then be exported to a PC for processing into charts and graphs and detailed analysis by the optional HealthScan™ software package, or your own spreadsheet application.
Fiber Optic Cable Test SupportMeasure fiber optic cables for power loss with the DSP-FTK Fiber Test Kit. It is used to detect bad connections, bad splices, broken fibers, and loss of power from bends and fiber type mismatches.
The kit contains a fiber optic meter for receiving signals from 850 nm, 1300 nm, 1310 nm and 1550 nm sources. An LED source for both 850 nm and 1300 nm is included in the kit, and allows for testing of multimode cable, with an optional 1310/1550 nm laser power source for testing single mode cable.
A FLT (Fiber Loss Test) is a very accurate method for the rapid detection of fiber optic eavesdropping devices, taps, and splices. While an OTDR will still need to be used, the Fiber Test Kit permits a "quick check" during the first stages of a TSCM inspection.
NIC/Hub TestsNetwork components can be tested by selecting this function.
Expert-T Autotest
A unique comprehensive test allows the LANMeter analyzer to be connected in series between a station and the hub or MAU. This test automatically isolates failures to cable, hub or MAU, NIC, or station software with confidence. (Ethernet shown.)
NIC Autotest
Tests new or suspected faulty NIC cards for correct operation. For Ethernet the test reports the MAC address, protocol, and driver voltage levels (and the presence and polarity of link pulses on 10BASE-T). If no signal is detected from the NIC the test will automatically scan for connector and cable faults. For Token Ring the test reports the result of the lobe test, checking for connector and cable faults if the lobe test fails, and reports the NIC speed, MAC address and phantom drive levels. This test does not require a live network connection. (Token Ring shown.)
EthernetHUB Autotest
Tests new or suspected faulty 100BASE-TX and 10BASE-T hubs for correct operation by testing for the presence and polarity of link pulses, and for hub transmit levels. Protocols detected are identified, and IP and IPX hosts are pinged to ensure connectivity. Cable tests are performed when a cable fault is suspected.
Token RingLobe Test
Verifies that a lobe cable is capable of supporting 4 Mbps and/or 16 Mbps Traffic.
MAU Autotest
Tests new or suspected faulty MAU port for correct operation by attempting to insert into the ring, reporting ring speed and indicating the presence of network activity. Cable tests are performed when a cable fault is suspected.
MAU Reset
Attempts to un-stick the relay in the attached MAU port and monitors network activity to verify correct relay operation.
Network TestsThese are a collection of Token Ring tests that measure network characteristics and poll network devices for information.
Station PingVerifies connectivity to a particular station. Station Ping may also be configured as either a Single Route or All Routes frame. If source routed bridges are used, the route to the target station and the maximum frame size allowed through that path will be displayed.
Phase JitterTests the amount of un-correlated phase jitter, a measure of noise, on an operational ring. Use the LANMeter analyzer to track down those hard-to-find problems related to slow response times, dropping connections or inability to attach to a server.
Adapter Status
Reports what functional role the target station is performing, as well as its NAUN and response time. The LANMeter analyzer displays the adapter status results after the targeted station responds, or no response from the target station if the configured timeout period expires. Use this test to discover the location of source-routed bridges on your network.
Remove StationWhile troubleshooting, it's easy to remove a suspect station from the ring by sending a Request Station Removal frame to the specified station.
Cable Tests100 MHz Cable Test Option 100 MHz Cable Test Option
These tests measure cable lengths and detect opens, shorts and other mis-wires in network cabling.
Cable Scan
Measures the length of the cable, the distance to the largest fault, and the characteristic impedance of the cable. When testing UTP cabling, split pairs, opens, shorts and other discontinuities can be found without a termination device. The wire map adapter can be connected to the far end of the cable to detect wiring problems and smaller impedance discontinuities such as split pairs at the far end.
For Ethernet networks, this test may be performed on a live coax network. For Token Ring networks, the cable scan test automatically detects the presence of a self-shorting IBM connector and correctly reports the cable length.
Wire MapChecks for mis-wires and for intermediate opens and shorts on twisted pair cable. A pin-by-pin connection list is displayed.
Cable IdentifierUsed to map UTP drop and lobe cables to individual offices from the wiring closet. Unique Cable identifier Remote Units are identified and displayed in the order detected. Up to thirteen identifiers can be connected.
Cable AutotestTests length, impedance, wire map, attenuation and NEXT up to 100 MHz (depending on configuration.) The specific tests run by Cable Autotest depend on the network specification configured. Cable Autotest may be used for coax, 150 ohm STP, or 100 ohm UTP. Testing 100 ohm twisted pair requires the optional 100 MHz remote adapter. If the optional 100 MHz remote adapter is used to test 100 ohm twisted pair cable, the results comply with EIA 568A, TSB-67 requirements for Level I test of Basic Link or Channel configurations. Test results may be viewed directly or stored for printing later.
DC ContinuityFor coax, use DC Continuity to verify that there are no missing or incorrect terminators.
Find NVPCalculates the Nominal Velocity of Propagation (NVP) for a cable of known length and optionally stores the value in a User Defined cable type or standard cable type.
Dimensions 29.2 x 17.8 x 6.7 cm (11.5 x 7.0 x 2.65 in)
Weight 2 kg (4.5 lbs)
Keyboard 36 key Elastomeric with alphanumeric and dedicated keys.
Display 240 x 128 pixel bit-mapped LCD. (H x W) 12 x 6.5 cm [4.75" x 2.5"]
LED Indicators 19 Light Emitting Diodes.
Power Removable/Rechargeable NiCad (9 Sub-C Cells) with average 3 hours operating time. Recharges in three hours.
Note: Continuous use of the display backlight will reduce battery operating time by approximately 33%.
Communication Port RS-232C Serial Port (DB-9)
Network Ports
Operating Temperature
10 to 30 C
Warranty One year (Extended warranty is available)
TDR Specifications
Resolution 0.3 m (1 ft)
Minimum Distance 0 m (0 ft) measures right up to connection point
Maximum Distance
Dependent on cable type
Measurement Accuracy
DC Resistance (BNC
Connector): 0 ohms to 200 ohms
Accuracy +/-10%
Cable Length 0 to 30 meters (0 to 100 ft)
+/-(1% of reading +0.3 m (1 ft))
30 to 300 meters (100 to 1000 ft) +/-2% of reading
Real-Time Clock The LANMeter time stamps the beginning and end of tests from an internal real-time clock.
Information Storage
Data Files Files may be saved internal to the unit. These files includes screen captures, ASCII formatted scrolling lists and data log information. The File manager provides management for saved files by allowing export to a PC via the LANMeter serial port or E-Mail over a network connection.
Station Lists A list of 512 addresses can be stored which establishes a symbolic name for MAC, IP, VINES IP and IPX addresses. Multiple station lists will support a maximum of 4096 stations.
Flash ROM Technology The LANMeter analyzer's Flash ROM technology protects your investment by allowing software updates to be loaded quickly and easily from you PC via an RS-232 serial link.
Cable Test Functions
Cable Types
Test Standards
Autotest The LANMeter automatically executes a series of measurements and compares the results against the selected network specification resulting in PASS/FAIL test results. Typical Autotest test time is under 90 seconds. The applicable tests are described below:
Cable Length
Resolution: 0.1m (1 ft)
Accuracy: 0 to 30m: +/-(1% of reading +0.5m;) 30 to 300m +/-2% of reading
Minimum Distance: 0m (0 ft)
Maximum Distance: depends upon the cable type
Characteristic Impedance
Twisted Pair Range: 50 ohms to 200 ohms
Coax Range: 25 ohms to 100 ohms
Accuracy: +/-(5 ohms + 5% of reading)
Test up to four pairs.
PASS/FAIL on pairs called out in selected network specification.
DC Resistance
500 ohms to 500 K ohms (+/-10%) RJ-45
10 ohms to 200 ohms (+/- 10%) BNC
Test Storage Up to 128 Autotest summary results
Features at a Glance
 Unparalleled Troubleshooting
The LANMeter along with the 100 MHz Cable Test Option is the only tool available that allows users to troubleshoot problems from the network layers all the way down to the hard-to-find cable problems. Plus, the optional 100 MHz Cable Test Option can be added to the LANMeter for half the price of a cable scanner.
Cabling problems often mask the true cause of the problem with symptoms such as dropped connections, server login problems, and poor network performance. Detecting and isolating these cabling problems requires versatile functionality from your troubleshooting tool. LANMeter, the fastest tool available for solving hard-to-find network problems, now extends its capabilities to include 100 MHz CAT 5 cable testing. Now one tool assists you through the entire troubleshooting process. The LANMeter's rich feature set can be used to isolate the fault domain. If the cable is the suspected culprit, Cable Autotest can be used to quickly verify the integrity of the cable installation. Non-compliant CAT 5 patch cables and connectors causing network problems can easily be found with 100 MHz NEXT and Attenuation measurements. You can now solve the problem, with one tool, no matter where it is in your network.
Does your CAT 5 Cable Plant Meet Specification?
The uncertainty of CAT 5 cable installations and testing requirements leaves network managers concerned. But now you can be sure that your CAT 5 cable installation meets TIA Link Committee standards (TSB-67). With the new 100 MHz Cable Test Option and a single button press of the cable Autotest softkey the LANMeter verifies CAT 5 cable installations to TSB-67 Level I accuracy requirements.
Autotest automatically executes a series of cable tests including Length, Impedance, Wire Map, Attenuation and NEXT. The NEXT and Attenuation measurements verify compliance of your CAT 5 cable installation all the way up to 100 MHz. The cable's performance is compared against the user selected cable standards resulting in easy to understand PASS/FAIL indicators for the over-all Autotest, as well as for each individual test.
With Cable Autotest and the 100 MHz CAT 5 Cable Test Option you can quickly identify a poorly implemented cable installation and direct the appropriate resources toward fixing the problem.
Pinpoint faulty cabling problems with the 100 MHz Cable Test Option
with CAT 5 cable testing.
With today's exploding network environment and constantly changing specifications, cabling problems are quickly becoming a major concern of network managers. That's because difficulties such as dropped connections, server login problems and poor network performance are often caused by unreliable cabling. Yet the true cause may go undetected.
Until now. With the LANMeter and Fluke's 100 MHz Cable Test Option, you can quickly detect and isolate those hard-to-find cable problems such as non-compliant CAT 5 patch cables and connectors. All at less than half the price of a stand-alone cable scanner.
Once the LANMeter isolates the fault domain, use the Cable Test Option's Autotest softkey to instantly execute a series of cable tests. Including Length, Impedance, Wire Map, Attenuation and NEXT. The NEXT and Attenuation measurements verify your compliance of your CAT 5 cable installation up to 100 MHz.
Cable Length
Resolution: 0.1m (1 ft)
Minimum Distance: 0m (0 ft)
Maximum Distance: depends upon the cable type
Type 1 (STP) under 600m (2,000 ft)
UTP 300m (1,000 ft)
50 ohm Coax over 600m (2,000 ft)
Accuracy: 0 to 30m: +/-(1% of reading +0.5m;) 30 to 300m +/-2% of reading
Characteristic Impedance
Twisted Pair Range: 50 ohms to 200 ohms
Coax Range: 25 ohms to 100 ohms
Accuracy: +/-(5 ohms + 5% of reading)
Wiremap
Test up to four pairs.
PASS/FAIL on pairs called out in selected network specification.
DC Resistance
500 ohms to 500 K ohms (+/-10%) RJ-45
10 ohms to 200 ohms (+/-10%) BNC
Test Storage
Up to 128 Autotest summary results
100MHz Cable Test Option
(Meets TIA Level I
accuracy requirements. Supports 100 ohm twisted pair cable only)
Analyze the performance of your network with the
HealthScan™ Option
With networks constantly changing and network traffic being altered by the minute, it's difficult to determine the exact status of your network. Unless, of course, you use the HealthScan Software Option with your Fluke LANMeter.
HealthScan automatically downloads key information from your LANMeter and quickly sorts and evaluates the data before creating simple, easy-to-read color-coded summary reports using Excel graphics. Through its easy-to-use, easy-to-learn Windows-like interface, you can use the software to confirm your network's good health, identify performance bottlenecks and expose potential problems before they affect network users.
By running regular performance check-ups on a daily, weekly or even
monthly basis, you can determine what normal operation looks like. Use
this network audit or baseline report as a reference point to determine
where bottlenecks are and how to eliminate them.
682 Enterprise LANMeter®, Ethernet
685 Enterprise LANMeter®, Ethernet/Token Ring
683 10/100 Ethernet Enterprise LANMeter®
686 10/100 Ethernet/Token Ring Enterprise LANMeter®
68X-002 100 MHz Cable Test Option
68X-SW SwitchWizard® Option (Ordered with new instrument)
68X-SWK SwitchWizard® Option (Ordered as an upgrade to an existing instrument)*
68X-WW WideAreaWizard® Option (Ordered with new instrument)*
68X-WWK WideAreaWizard® Option (Ordered as an upgrade to an existing instrument)**
C6700 Soft Carrying Case
N6701 Battery Pack
N6703
UTP Accessory Kit
N6705
Coax Accessory Kit
N6707 IBM Data Connector to RJ-45 Adapter
N6708 Cable Locator Kit 1: 6 Cable Locator Units (#'s 1-6)
N6709 Cable Locator Kit 2: 6 Cable Locator Units (#'s 7-12)
N6800/E LANMeter® HealthScan® for Ethernet*
N6800/ET LANMeter® HealthScan® for Ethernet/Token Ring*
N6800/T LANMeter® HealthScan® for Token Ring*
RS42 Printer Cable (DB-9 to DB-25)
*Requires LANMeter firmware 5.x or higher, Microsoft Windows
version 3.1 or higher and Excel version 4.0 or higher on
PC.
**At this time, the WideAreaWizard option is only
available for the 683 and 686 Fast Ethernet Enterprise LANMeters.
Existing 680, 682 and 685 users should stay tuned to this page for
upcoming information.
Why is Internet access slow today? How often do you hear that question from network users? Are you constantly concerned about the performance of your expensive Wide Area Links? The Enterprise LANMeter test tool with its WideAreaWizard option simplifies management and troubleshooting of costly WAN links by accessing SNMP agents in routers, switches and bridges utilizing standards-based MIBs to provide you with information on frame relay, ISDN and T1/E1 performance and health.
Information that WideAreaWizard provides includes:
|
To be contacted for a confidential consultation please E-mail: jmatk@tscm.com
or send a letter via US Mail to:
or call:
URL: http://www.tscm.com/ |